Civil Society Organization Data Fellowship

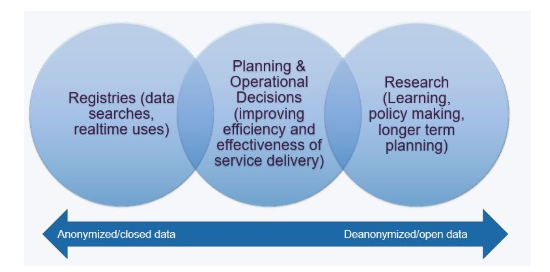
What is Open Data?
What is Open Data?
Laying foundations
- What is data?
- Why is it important?
- Why should data be open?
- Why should there be a standard?
What is data?

Data is a collection of facts in the form of:
- Numbers
- Words
- Measurements
- Observations
- etc
What is this?
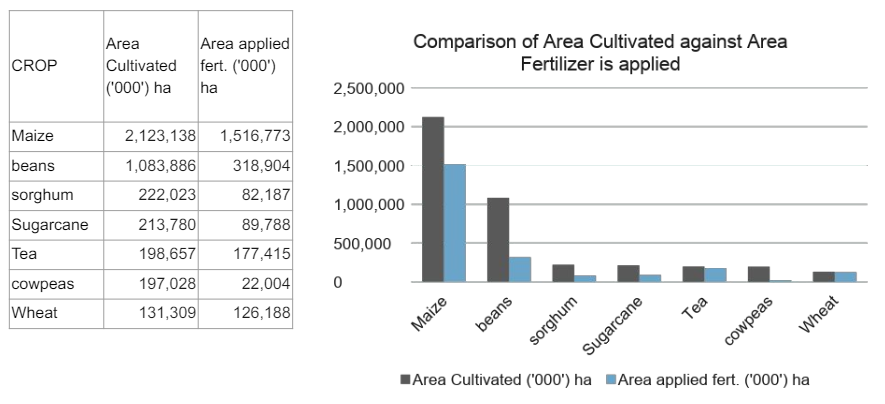
Maize 2,123,138 1,516,773 71.4 272,730,660.51 128.46
What about this?
|
Maize |
2,123,138 |
1,516,773 |
71.4 |
272,730,660.51 |
128.46 |
What about this?
|
Maize |
2,123,138 |
1,516,773 |
71.4 |
272,730,660.51 |
128.46 |
|
beans |
1,083,886 |
318,904 |
29.4 |
21,200,411.50 |
19.56 |
|
sorghum |
222,023 |
82,187 |
37.0 |
9,094,112.10 |
40.96 |
|
Sugarcane |
213,780 |
89,788 |
42.0 |
173,103,519.20 |
809.73 |
|
Tea |
198,657 |
177,415 |
89.3 |
101,036,570.00 |
508.60 |
|
cowpeas |
197,028 |
22,004 |
11.2 |
2,045,940.45 |
10.38 |
|
Wheat |
131,309 |
126,188 |
96.1 |
25,621,563.00 |
95.12 |
What about this?
|
CROP |
Area Cultivated ('000') ha |
Area applied fert. ('000') ha |
Application rate (%) |
TOTALS OF FERTILIZER TYPE PER CROP (KG) |
Fertilizer consumption (kg/Ha) |
|
Maize |
2,123,138 |
1,516,773 |
71.4 |
272,730,660.51 |
128.46 |
|
beans |
1,083,886 |
318,904 |
29.4 |
21,200,411.50 |
9.56 |
|
sorghum |
222,023 |
82,187 |
37.0 |
9,094,112.10 |
40.96 |
|
Sugarcane |
213,780 |
89,788 |
42.0 |
173,103,519.20 |
809.73 |
|
Tea |
198,657 |
177,415 |
89.3 |
101,036,570.00 |
508.60 |
|
cowpeas |
197,028 |
22,004 |
11.2 |
2,045,940.45 |
10.38 |
|
Wheat |
131,309 |
126,188 |
96.1 |
25,621,563.00 |
195.12 |
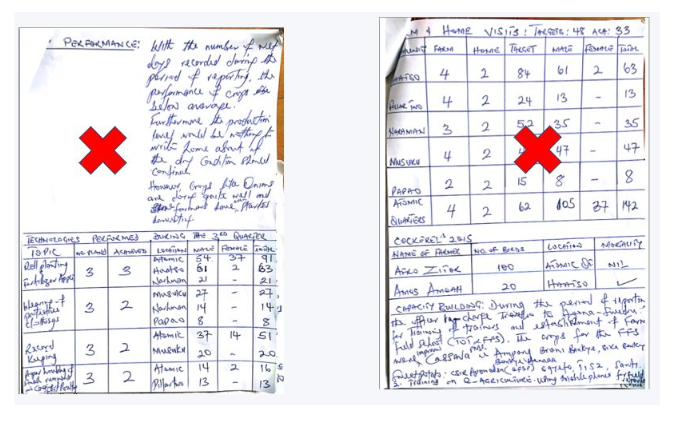
Structured vs Unstructured data

Why is presenting data in a structured way important?
Structured vs Unstructured data
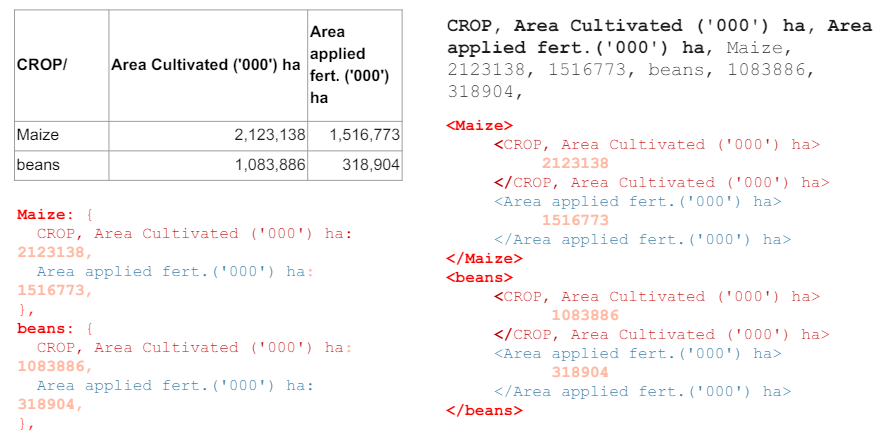
What are the formats of data?
- Comma Separated Values (CSV)
- Tabular data (as found in spreadsheets)
- JSON
- XML
What are formats of data?
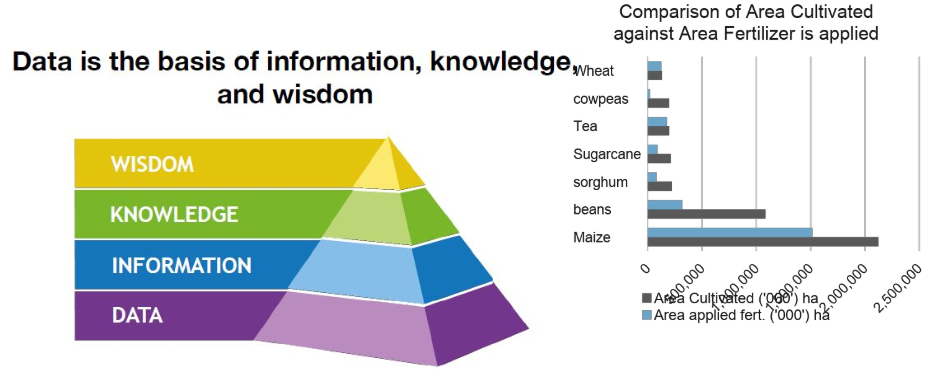
Why is data important?
Why should data be open?
Broad et. al. (2015, p.35) offer this definition of open data, it is “… data made available by governments, businesses and individuals for anyone to access, use and share.”
Additional tenets
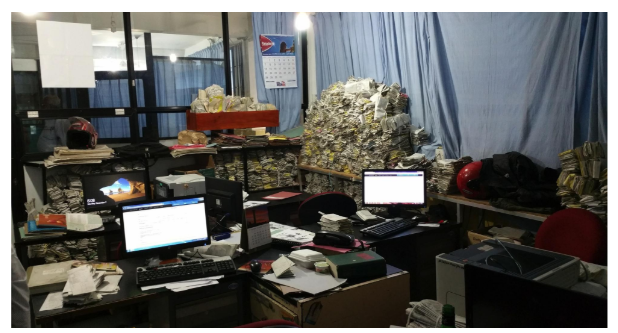
- Accessible
- Machine Readable
- Reusable
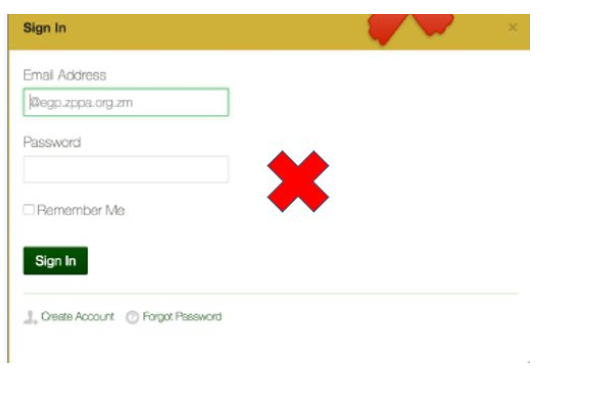
Accessible
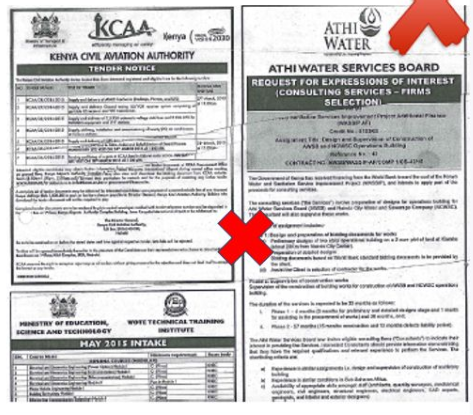
Machine readable
Reusable

Somo is an eLearning platform that offers a range of online courses focusing on data-driven decision-making, community leadership, financial management, and more.